Overview of tissue elastography
Currently, diseases of fibrosis, liver cancer, thyroid, and breast tumors are increasing. Former ultrasound detection of these conditions is possible, but often at a late stage. The exact identification of the pathology requires an organ biopsy to make the pathology (an invasive technique, that causes pain for the patient).
With the development of science, the technique of elastography ultrasound can help doctors diagnose liver fibrosis, and tumor stiffness in the thyroid, and mammary gland (the harder the tumor, the higher the malignancy).
Tissue elastography is a new ultrasound technique in the ultrasound industry, that helps to determine the stiffness of organs and lesions. The technique is performed like a normal ultrasound on an ultrasound machine with tissue elastography, so it is non-invasive and painless for the patient. The accuracy of the researched technique is appropriate approximately 90% compared to biopsy for pathology, helping to minimize unnecessary organ biopsies for patients.
Background of Elastography Development
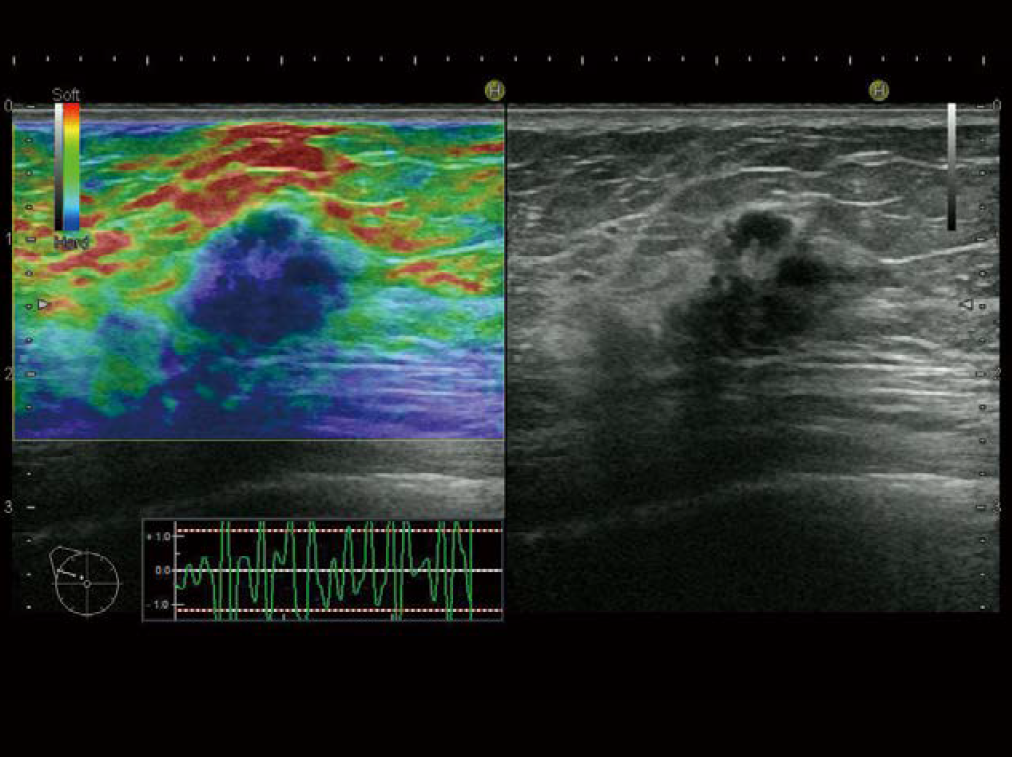
Cancerous tissue becomes stiffer as the density of blood vessels and/or cells increases. This stiffening is believed to start from the early stages of development of the cancer. Visualization of stiffness data, therefore, could enable early-stage differentiation of benign and malignant tissue. Elastography has been developed for non-invasive imaging of tissue elasticity (stiffness) using a diagnostic ultrasound system. The transducer is used to gently compress the tissues, and the resultant pattern of induced strain gives diagnostic information about the tissue stiffness. Hitachi was the first company to commercialize Real-time Tissue Elastography (hereafter RTE) as a method for tissue stiffness visualization. Now, RTE is clinically applied in many medical institutions.
Methods and Principles of Elastography
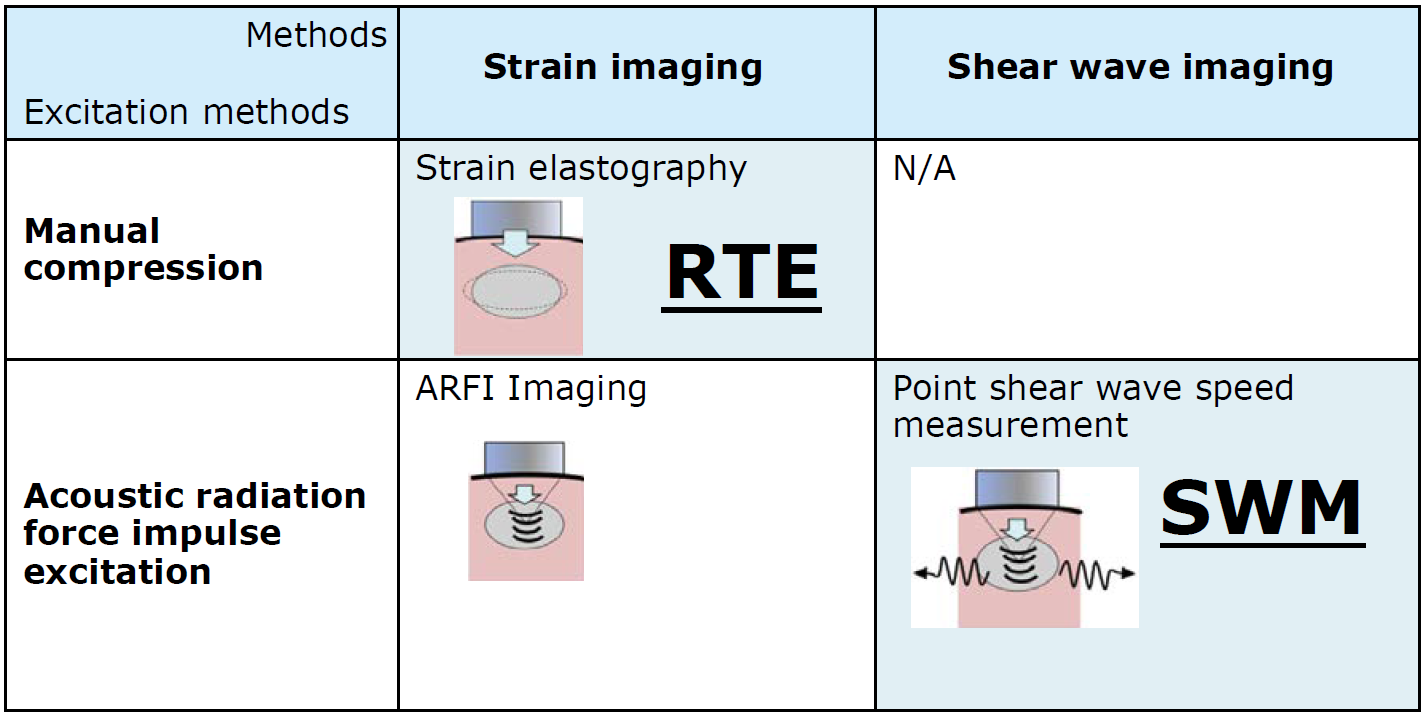
The guidelines of the World Federation for Ultrasound in Medicine and Biology (hereafter WFUMB) classify Elastography methods as shown in Table 1.
Elastography methods can be classified into two main types: strain imaging and shear wave imaging.
RTE is classified as strain imaging, while Shear Wave Measurement (hereafter SWM) is classified as shear wave imaging method. The different principles are explained below.
Principles of Real-time Tissue Elastography (RTE) (Strain Elastography)
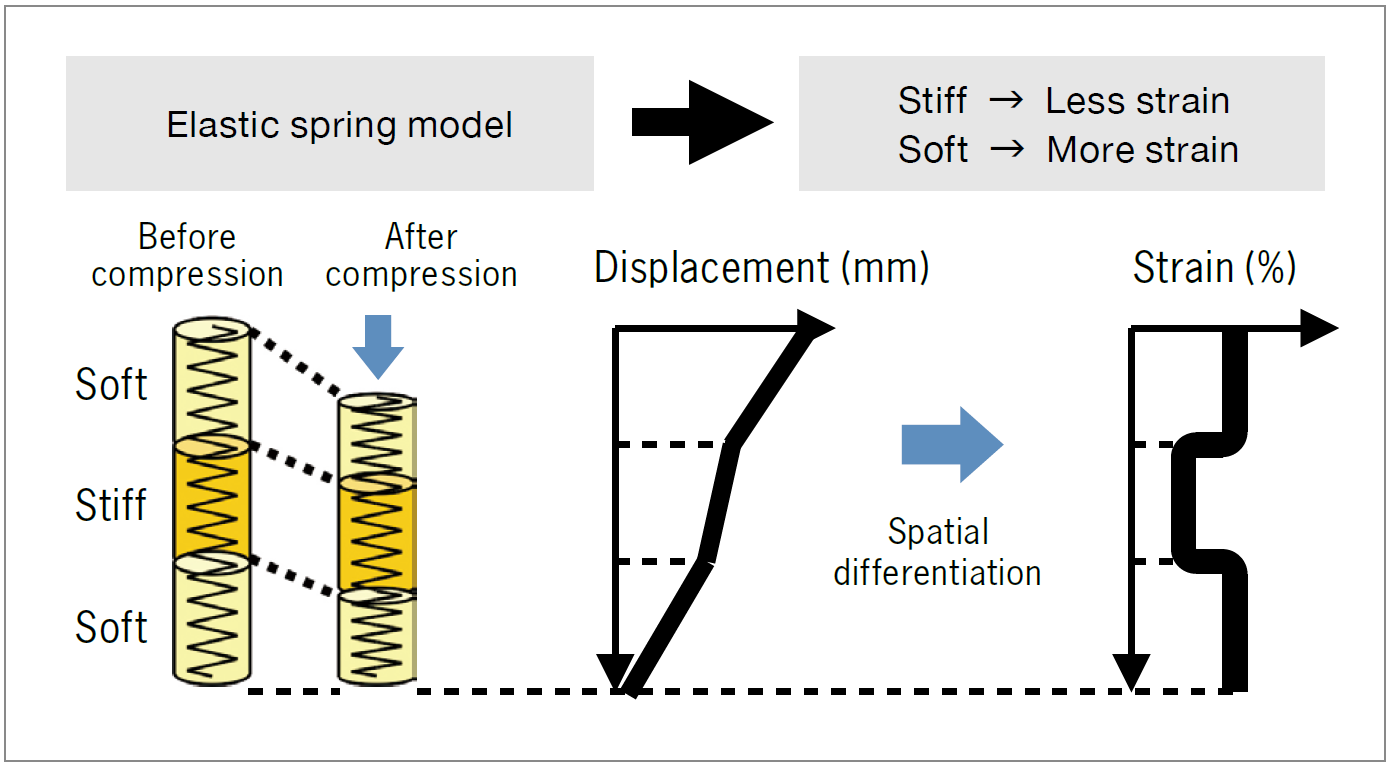
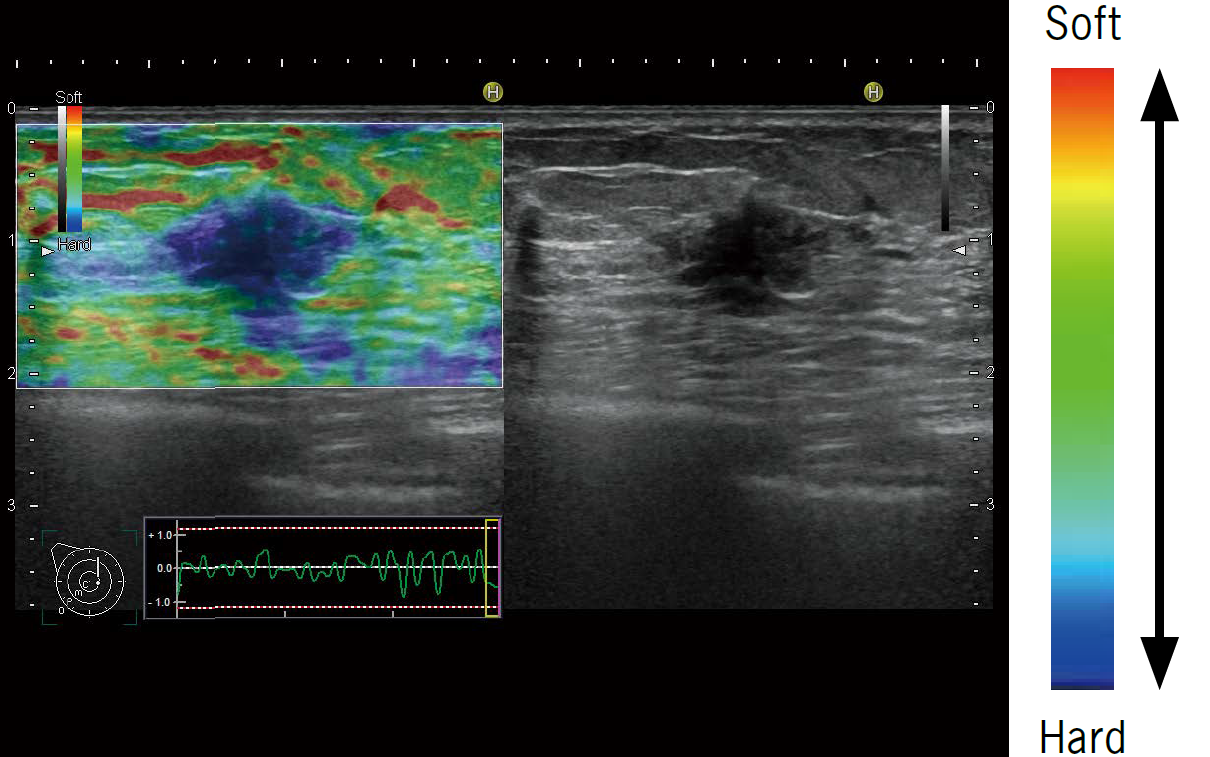
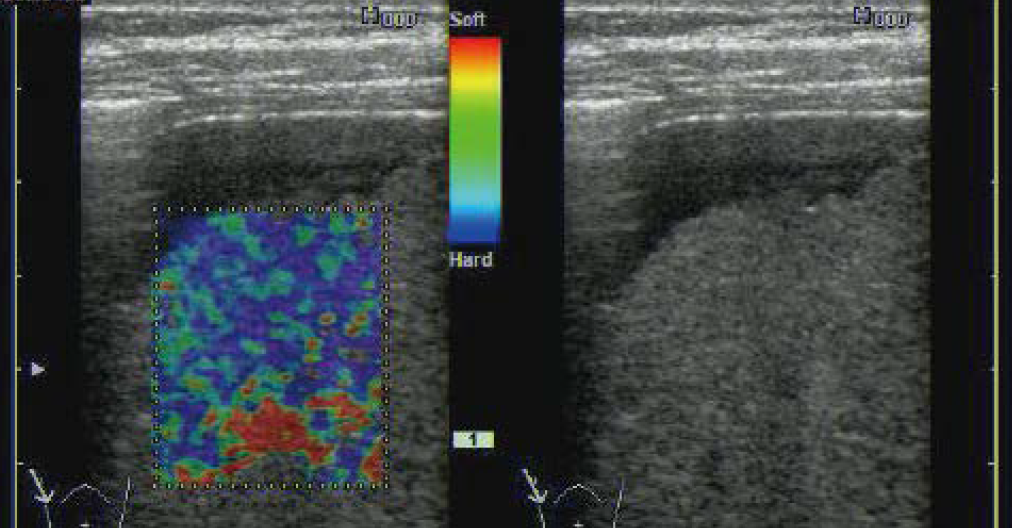
Under a constant applied force, soft tissue will show significant strain while stiff tissue shows little strain (Fig. 2). These tissue characteristics can be color-coded and displayed as a strain map which can be superimposed on the corresponding B-mode image. Areas demonstrating relatively less strain (stiffer parts) in the region of interest (ROI) will be colored blue, areas demonstrating relatively more strain (softer parts) in red, with the areas of mean stiffness in green (Fig. 3).
Principles of Shear Wave Measurement (SWM) (Point Shear Wave Speed Measurement)
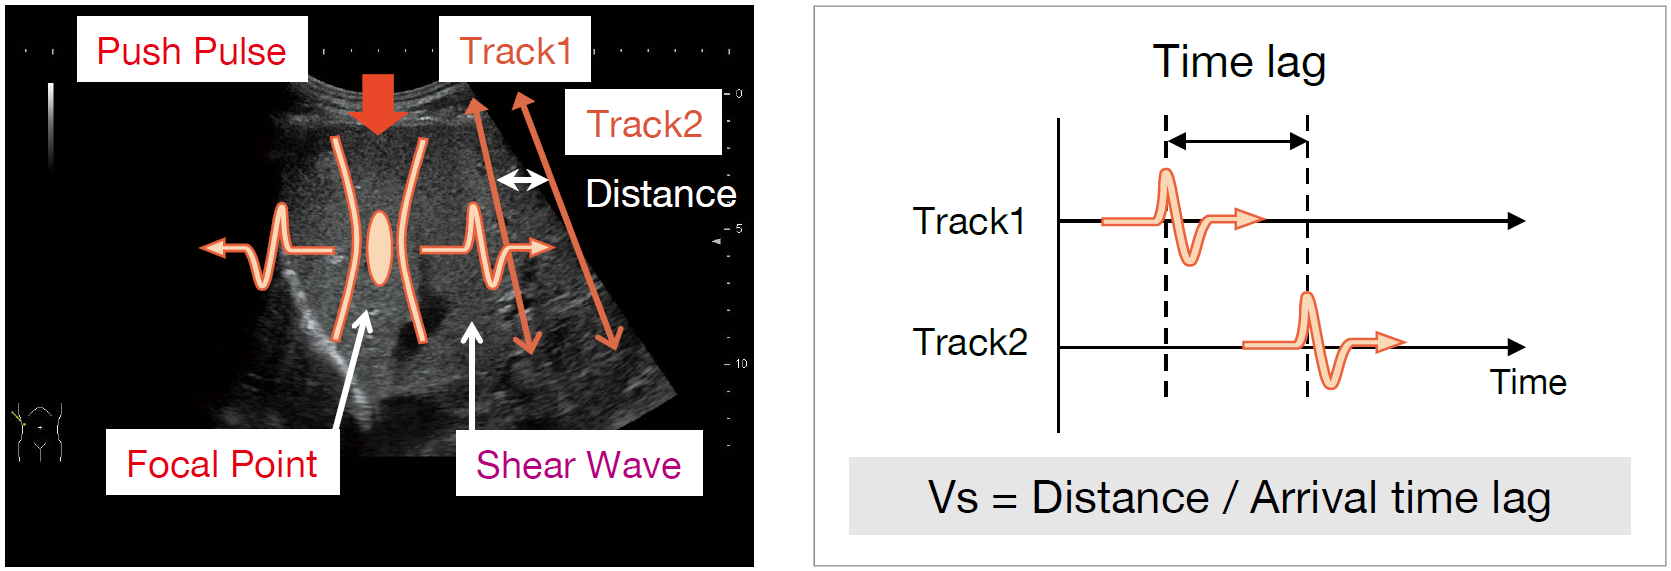
A focused ultrasound pulse is transmitted by the transducer. From the resultant displacement of the tissue, shear waves are generated and propagate off-axis. Tracking pulses are used to detect the propagation velocity of the shear wave (Vs) by measuring the difference in arrival time (time lag) between the two points a known distance apart (distance) (Fig. 4).
Clinical Benefits of Elastography
In the diagnosis and treatment of diffuse liver disease, it is extremely important to determine which patients are suitable for antiviral therapies, predict their curative effects, and correctly diagnose the degree of liver fibrosis. Though regarded as the gold standard for diagnosis, a liver biopsy is an invasive examination and therefore cannot be repeated frequently. Ultrasound Elastography has been reported as an effective method for evaluating the level of fibrosis non-invasively in all diffuse liver diseases and could provide an alternative to liver biopsy.
Features of Each Method
(1) Provides an accurate measurement of the degree of liver fibrosis.
Assessment with RTE (LF Index) is known to be unaffected by inflammation, congestion, or jaundice.[4]
(2) Allows measurement in patients with ascites.
(3) Assessment can be made with a standard convex transducer.
<Imaging Method>
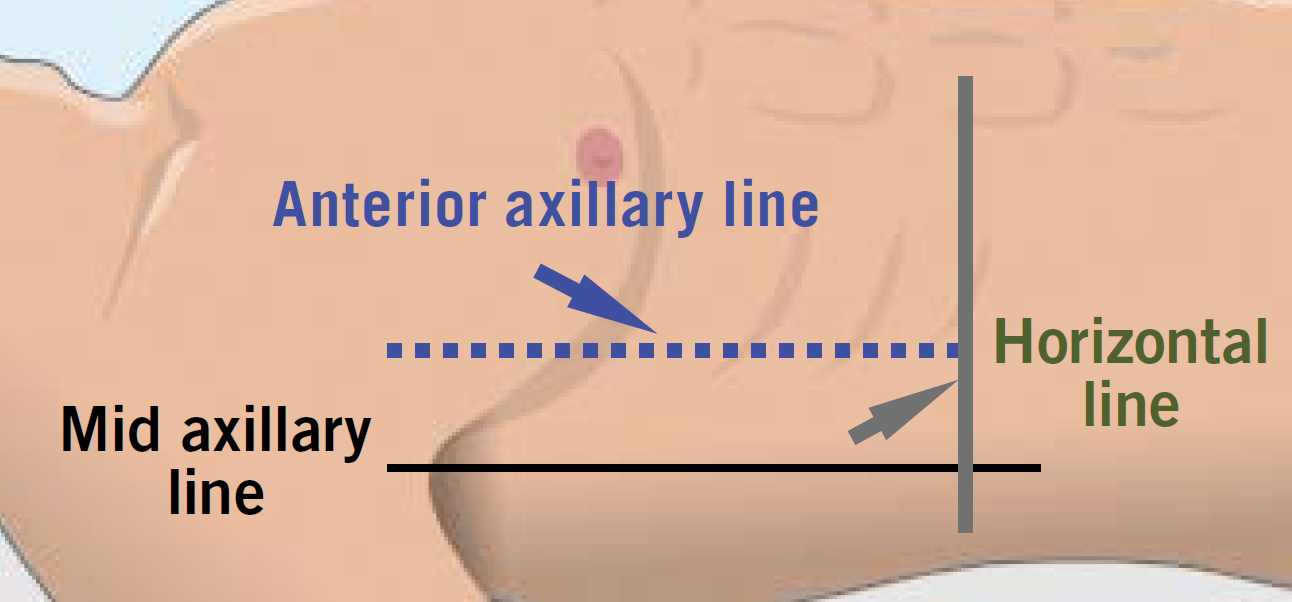
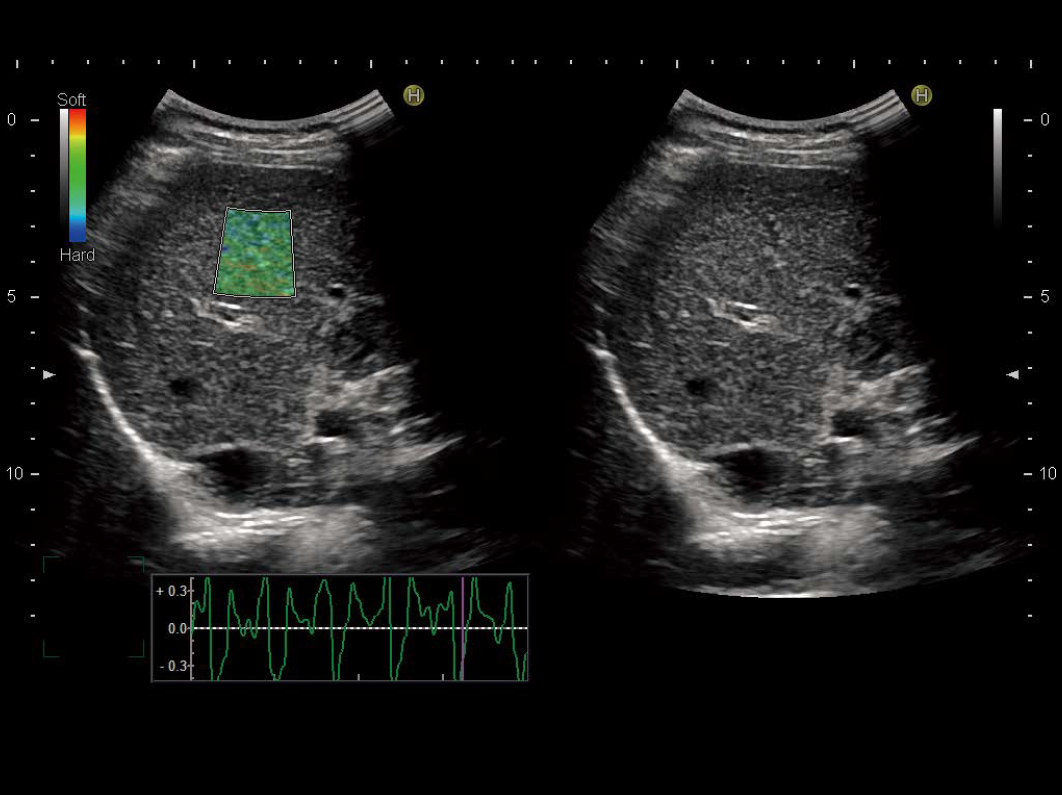
With the transducer placed in a right intercostal space (around S5/S8) between the anterior and mid axillary line, scanning is performed to obtain a RTE image of the liver using heart beat-induced strain (Fig.10)
<Assessment with RTE> - Comparison with the New Inuyama Classification -
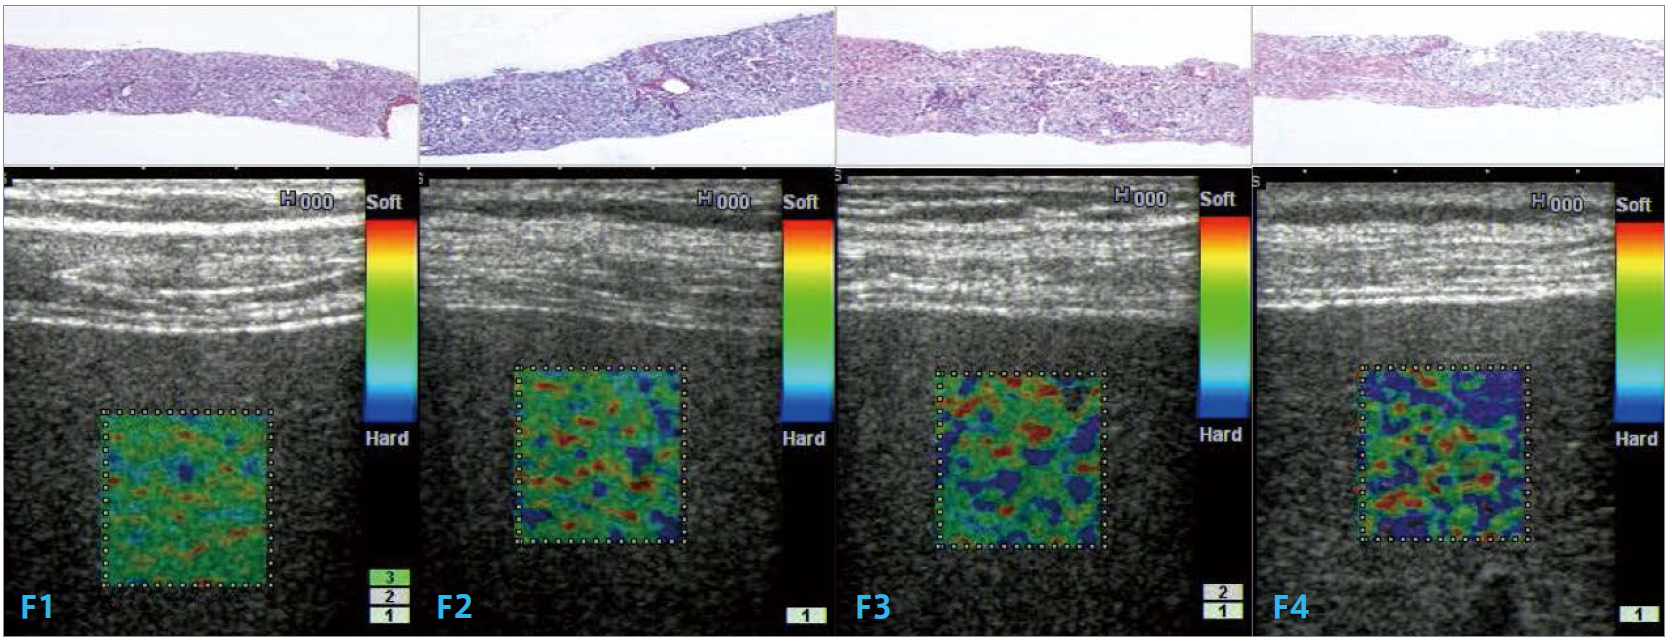
As liver fibrosis develops in patients with hepatitis, the tissue shows local variations in stiffness. The stiffer regions (blue areas) increase in number and size, and the RTE image takes on a mottled appearance.[5] Hepatitis staging is diagnosed using an invasive biopsy, but RTE allows a non-invasive assessment that can be used frequently in follow-up observation and treatments.
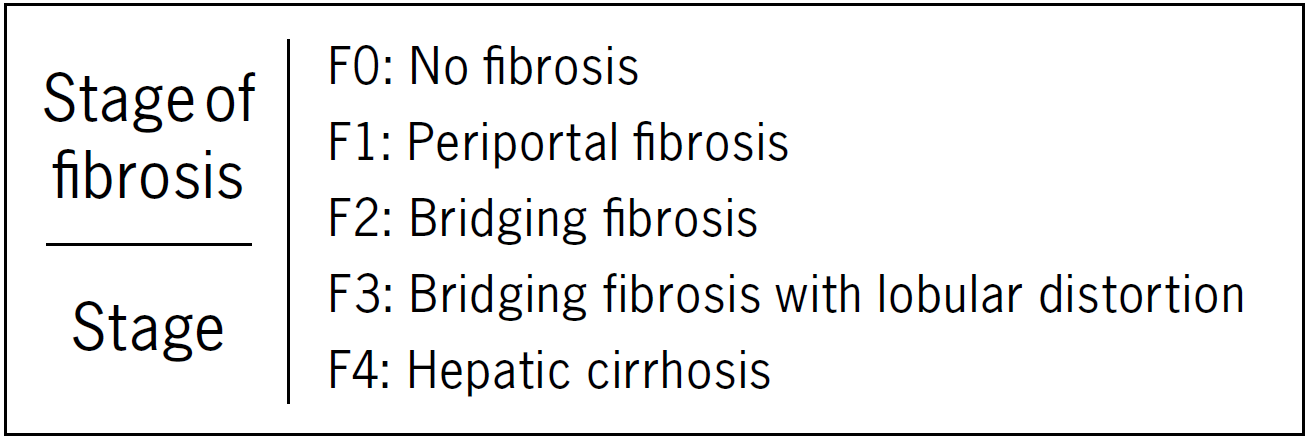
Fig. 11 shows RTE images paired with a pathological tissue specimen for each fibrosis stage as classified using the New Inuyama Classification (Table 3).
<RTE-specific Functions for Liver Fibrosis Assessment>
Liver Fibrosis Index (LF Index) measurement
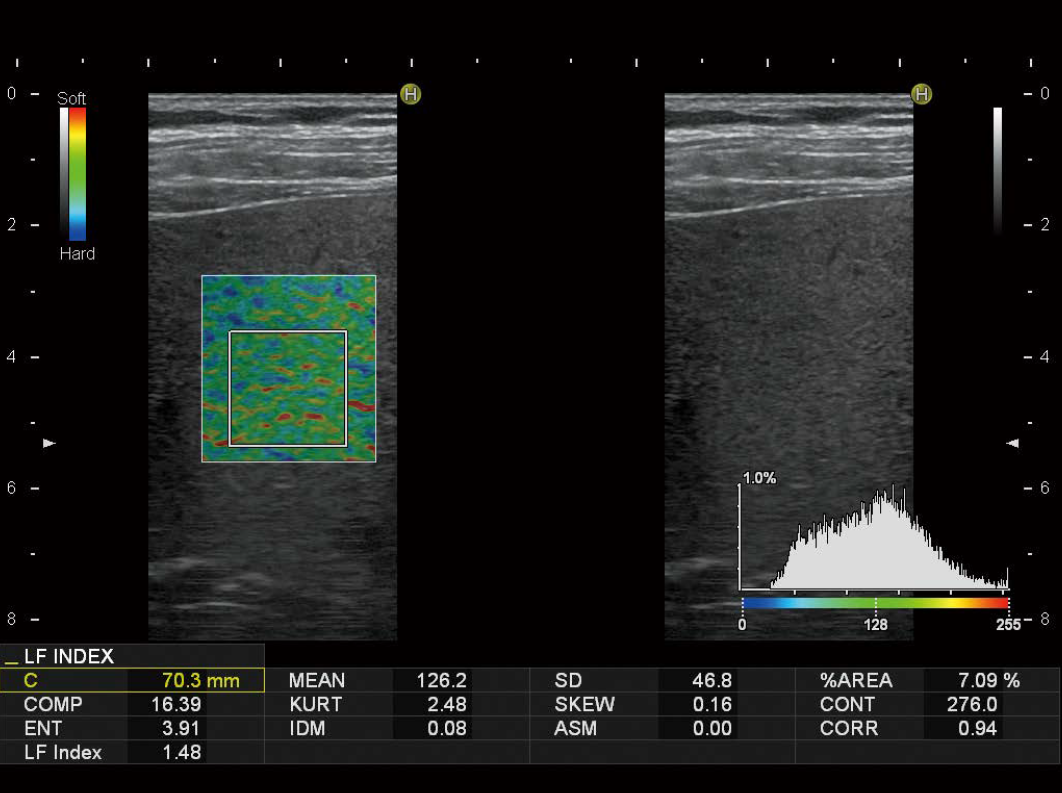
The LF Index is a unique measurement for liver fibrosis assessment. From an analysis of the RTE image pattern of the liver with hepatitis C, the hepatitis stage can be estimated as an LF Index value (Fig. 12). The formula is calculated based on a multiple regression analysis with nine different feature values as independent variables, and histopathological fibrosis diagnosis F stages as dependent variables. The LF Index correctly reflects the degree of liver fibrosis without influence from inflammation, jaundice, and so on.
Compatibility with convex transducers
Convex transducers support RTE and hence enable RTE to be performed immediately as an extension of the conventional routine ultrasound examination. They provide a wide field of view for visualization making it easy to direct the imaging towards the heart. This results in RTE images with high reproducibility. In addition, convex transducers offer good penetration and can reduce the incidence of poor imaging in conventionally difficult-to-image cases, such as patients with fatty liver disease.
SWM-specific Functions for Liver Fibrosis Assessment
It has been reported that liver fibrosis assessment using shear wave speed measurement methods can ascertain the degree of fibrosis as well as that of inflammation, because the degree of inflammation, congestion, and jaundice affects the measurement results.
<Shear Wave Measurement (SWM)>
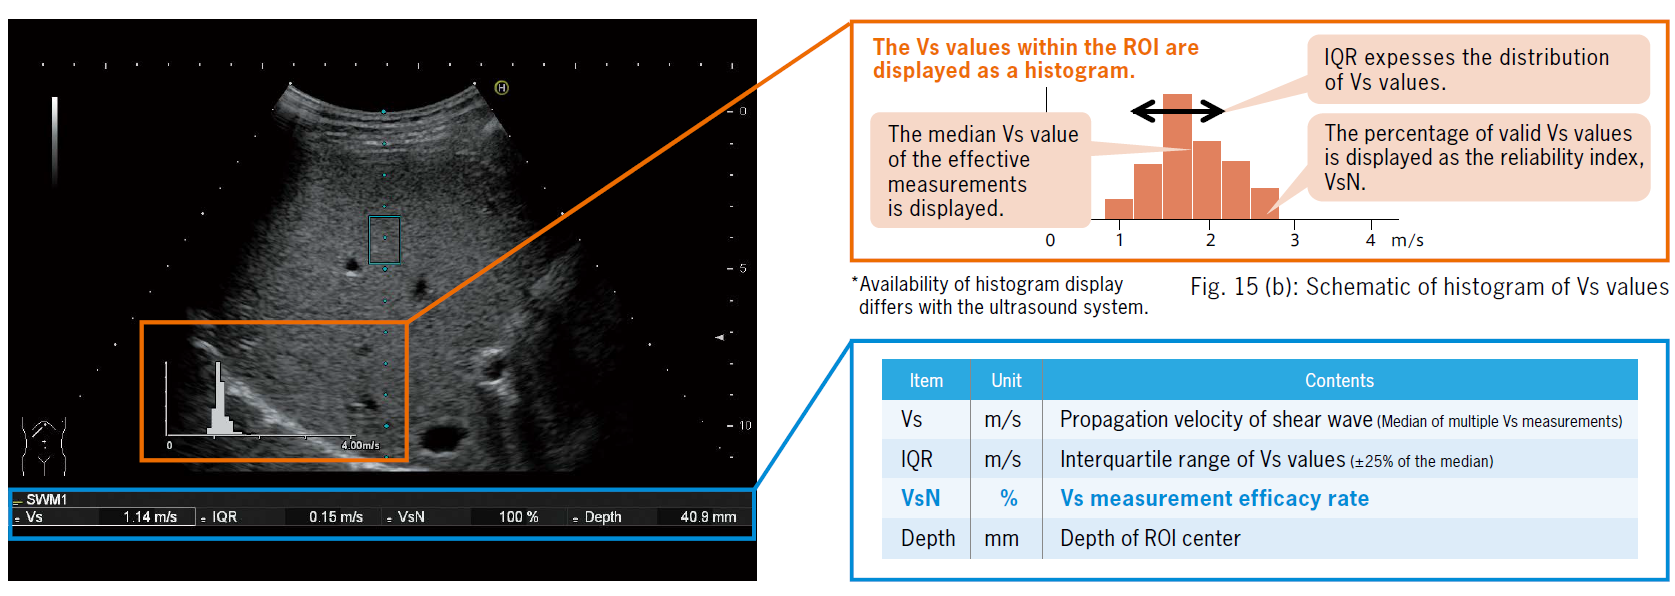
Once the ROI is placed at the measurement site in the liver parenchyma, the measured value will appear in approximately two seconds.
<Features of SWM>
Evaluation of the measurement reliability using VsN
Fig. 16: Schematic of automatic multiple measurements The measurement of the true shear wave propagation velocity in tissue can be affected by breathing or other body movements from the patient, or lack of steadiness of the examiner's hand. In such cases, it may be difficult to determine the reliability of the measurement based only on the value of the shear wave propagation velocity (Vs). The reliability indicator (VsN) shows the ratio of effective values from the total number acquired with each measurement. This function allows the user to determine the reliability of the measurement.
%20display.png)
Summary
Combinational Elastography using the Vs measurement obtained by SWM, with evaluation using RTE at the same time is useful for correctly assessing the clinical condition of the liver. Development of the SWM technique and RTE with a convex transducer has made it possible to perform Combinational Elastography in series following the normal ultrasound examination, using the one transducer. Non-invasive diagnosis of liver disease has become more easily accessible using ultrasound Elastography.
Sources:
[1] https://benhvientinh.quangtri.gov.vn/vi/news/kien-thuc-y-khoa/ung-dung-sieu-am-dan-hoi-mo-trong-benh-ly-gan-tuyen-giap-tuyen-vu-547.html
[2] Elastography ATLAS